 |
| ||||||
Printouts from a 20s Power Outage
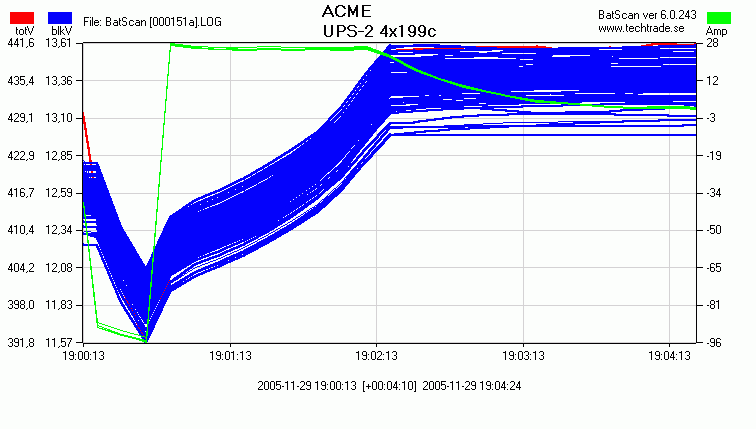
By analyzing the values that has been recorded during a "natural" power outage, cells that have deteriorated can be detected without the need for a complete discharge test.The graphs below shows a time diagram with the measured values from a UPS battery at a 20 second power outage. The battery is configured as 4 parallel strings with 199 cells in each string, totally 796 cells.
The total voltage is shown in red in the left scale labeled "totV". Each individual block voltage is shown in blue using the scale labeled "blkV". The current in each battery string is shown in green in the right scale labeled "Amp".

At the outage that occurs soon after 19:00, each battery string is loaded with approximately 90 Amp, totally 360A for the whole battery. The total voltage falls from 441.6 till 391.8 Volt and none of the block voltages falls below 11.57 Volt.
All measured values seem normal, and all cells can handle the load current during the short outage. When power is restored the UPS immediately starts recharging the battery with 28A in each string. When the battery voltage reaches normal float level, the charge current begins to fall down to stand-by level.
Although this battery looks OK, there is one cell that is about to fail and to find out which you must do a more thorough analysis. Continued below...
Advanced analyzing with Batscan
With Batscan's capability to do advanced analysis of measured values, data from even a short power outage of only a few seconds can be used to make an accurate diagnosis of the battery's condition.
The same principle that is used for comparing individual cell voltages to the average of cell´s voltages at a specific time, can also be used to analyse change over time.
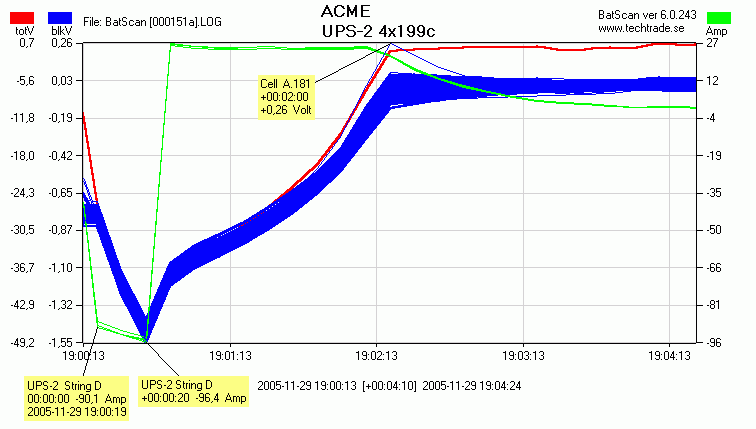
The normal deviation of the individual cell voltage absolute value, that can be has high as 0.100V, makes small relative differences hidden in the above graph. However, by using each cells own measured value right before the power outage as reference, very small differences in each cells ability to resist a change in current can be analyzed.

In this graph, with only relative changes, it is shown that the total voltage falls by 49.2V at the outage. It is also shown that none of the block voltages falls more than 1.55V at the discharge. Here one can also clearly see that the voltage over one of the battery cells rises abnormally fast and too high at the end of the recharge period. This may be caused by a defect in the cell that can cause an open cell condition at a later time of discharge.
With Batscan failing cells can be identified long before they severely affects the battery. With a less capable measuring system or by manual methods it would be impossible to find the faulty cell.